Branditify

Dashboards & analytics

Turn scattered business data into one clear view.

Branditify builds custom dashboards that bring metrics, reports, operations and decisions into one role-based interface — built on the systems you already run.

See dashboard types
Explore all software
  • Built on your systems
  • Role-based views
  • Reporting that updates

Your systems

CRMLeads, stages, ownersERPOrders, stock, dispatchSpreadsheetsTargets, budgetsEcommerceOrders, returnsAd platformsSpend, clicksAccountingInvoices, payments

Metric layer

Revenuefrom erp · store · booksQualified pipelinefrom crmOrdersfrom erp · storeCost per leadfrom ads · crmCollections duefrom books

One dashboard

Executive viewIllustrative · sample data
Revenue₹48.2L+6.4%
Qualified pipeline₹1.9Cr+2.1%
Orders1,284−3.0%
Collections due₹7.6L+11%

Revenue, last 12 weeks

Pipeline by stage

New62
Qualified44
Quoted28
Negotiation17
Won11

Revenue by channel

Direct44%
Marketplace28%
Retail19%
Partner9%

Needs attention

Invoices past 60 days
Stock below reorder
Deals with no next date

Six places hold the truth

Role-based views

Same business. A different view for each role.

A founder, a sales lead, an operations manager and a finance controller are looking at one system. What each of them needs on screen has almost nothing in common.

Where the business stands, and what needs a decision this week.

What is in the pipeline, what is going cold, and who owns it.

What is in flight, what is stuck, and where the queue is building.

What is owed, what is ageing, and what is likely to land this month.

Founder viewIllustrative · sample data
Revenue₹48.2L+6.4%
Cash in bank₹22.7L−1.8%
Qualified pipeline₹1.9Cr+2.1%
Open exceptions9+3
Sales viewIllustrative · sample data
Open deals162+8
Due today23+5
Conversion18.4%+1.2pt
Target attained71%+9pt
Operations viewIllustrative · sample data
Orders in flight318+12
Past SLA14+4
Fulfilment rate94.1%−0.8pt
Below reorder7+2
Finance viewIllustrative · sample data
Outstanding₹7.6L+11%
Collected MTD₹31.4L+4.9%
Past 60 days₹1.8L+22%
Avg days to pay38+3

Revenue vs target, last 12 weeks

Target

Pipeline by stage

New62
Qualified44
Quoted28
Negotiation17
Won11

Work in progress

Made to orderProductionAssignedOn time
Stock buildMaterialsAssignedShort
Made to orderQualityAssignedIn check
ReworkProductionUnassignedPast SLA
Stock buildDispatchAssignedReady

Receivables by age

Current
1–30 days
31–60
60+

Collections, last 12 weeks

Needs a decision

Two invoices past 90 days
Hiring plan over budget
One supplier late twice

Revenue by channel

Direct44%
Marketplace28%
Retail19%
Partner9%

Deals going cold

0–7 days
8–14
15–30
30+

Pipeline by source

Inbound46%
Referral26%
Outbound18%
Repeat11%

Where the queue sits

Materials34%
Production41%
Quality17%
Dispatch8%

Past SLA

Four batches in Production
Two lines below reorder
One rework unassigned

Chasing this week

Retainer62 daysEscalate
Milestone41 daysChase
Milestone18 daysDue
Retainer4 daysSent

Not in this viewIndividual salaries, personal performance records

Not in this viewCompany cash position, payroll, supplier terms

Not in this viewDeal values, margins, customer pricing

Not in this viewLead sources, campaign spend, individual rep activity

How it works

From data to decision.

A dashboard is only as good as what sits behind it. Every number on screen has a path: a system it comes from, a rule that cleans it, a definition that makes it comparable, a surface that shows it and something it lets you do.

CRM

Lead stages normalised, duplicates merged, owners resolved

Conversion rate by stage and source
Sales dashboardlive

Chase what is going cold, forecast the month

ERP

Order status mapped to one set of stages across plants

Fulfilment rate and time in stage
Operations dashboardlive

Clear the bottleneck before it becomes an SLA breach

Accounting

Invoices matched to payments, credit notes netted off

Outstanding by age and by customer
Finance dashboardscheduled

Chase the right invoice, in the right order

Ad platforms

Campaign spend attributed to leads that actually arrived

Cost per qualified lead by channel
Marketing dashboardscheduled

Move budget off what is not converting

How current the numbers are depends on the source, not on us.
Live or near-liveWhere the source system exposes an API or a database we can read directly. Numbers move within seconds to minutes.
Scheduled refreshWhere the source allows a periodic pull or export. Numbers are current as of the last run, and the dashboard says when that was.
Manual importWhere a source has no API and no export we can schedule. Someone uploads a file and the dashboard timestamps it.

We scope which of these applies to each source before anything is built, and the dashboard always shows how fresh a number is. Nothing here is promised as real-time in general.

Dashboard playground

What do you want to see?

Six of the dashboards we are asked for most. Each one is laid out for the questions that function actually asks — not the same chart set with different labels.

Where is the revenue coming from, and what is about to slip?

What is owed, how old is it, and what lands this month?

What is in flight, what is stuck, and where is the queue building?

What is the spend buying, and which channel deserves more?

What is selling, what is not shipping, and what is running out?

Is the business on track, and what needs me this week?

Sales dashboardIllustrative · sample dataFinance dashboardIllustrative · sample dataOperations dashboardIllustrative · sample dataMarketing dashboardIllustrative · sample dataEcommerce dashboardIllustrative · sample dataExecutive dashboardIllustrative · sample data
Open deals162+8
Conversion18.4%+1.2pt
Avg deal age19d+2d
Target attained71%+9pt
Outstanding₹7.6L+11%
Collected MTD₹31.4L+4.9%
Past 60 days₹1.8L+22%
Avg days to pay38+3
In flight318+12
Past SLA14+4
Fulfilment94.1%−0.8pt
Unassigned6+6
Spend MTD₹4.1L+7%
Qualified leads246+18
Cost per lead₹1,667−4.2%
Lead to deal11.8%−0.6pt
Orders today184+11
Revenue today₹3.2L+8.4%
Returns open17+3
Out of stock9+4
Revenue₹48.2L+6.4%
Cash in bank₹22.7L−1.8%
Pipeline₹1.9Cr+2.1%
Fulfilment94.1%−0.8pt

Pipeline by stage

New62
Qualified44
Quoted28
Negotiation17
Won11

Collections, last 12 weeks

Work in progress

Made to orderProductionAssignedOn time
Stock buildMaterialsAssignedShort
Made to orderQualityAssignedIn check
ReworkProductionUnassignedPast SLA
Stock buildDispatchAssignedReady

Qualified leads by channel

Search
Referral
Social
Email
Direct

Revenue by product line

Line A
Line B
Line C
Line D
Line E

Revenue vs target, last 12 weeks

Target

Lead ageing

0–7 days
8–14
15–30
30+

Receivables by age

Current
1–30 days
31–60
60+

Queue by stage

Materials34%
Production41%
Quality17%
Dispatch8%

Cost per lead by channel

Referral
Direct
Search
Email
Social

Fulfilment status

Dispatched62%
Packed18%
Picking13%
Held7%

Revenue by channel

Direct44%
Marketplace28%
Retail19%
Partner9%

Closed by owner, this quarter

Owner A
Owner B
Owner C
Owner D
Owner E

Invoices to chase

Retainer62 daysFinanceEscalate
Milestone41 daysFinanceChase
Milestone18 daysAccount leadDue
Retainer4 daysAccount leadSent

Exceptions

Four batches past SLA in Production
Two lines below reorder level
One rework batch unassigned

Qualified leads, last 12 weeks

Not shipping

PrepaidOut of stock3 daysBlocked
CODAddress check1 dayPending
PrepaidAwaiting pickup2 daysCourier
PrepaidHeld for QC1 dayIn check

Needs a decision

Two invoices past 90 days
Hiring plan over budget
One supplier late twice this month

Illustrative interface. Sample data, not Branditify or client results.

The control room

Eight dashboards. Eight different questions.

A dashboard is not a type of chart. It is a working surface designed around who is looking and what they have to decide — which is why these eight look nothing like each other.

Who it is forFounders, directors

Who it is forSales leads, reps

Who it is forControllers, accounts

Who it is forOps managers, plant leads

Who it is forMarketing leads, agencies

Who it is forCategory and fulfilment teams

Who it is forYour customers, logged in

Who it is forWhoever runs the system

Is the business on track, and what needs a decision?

What is in the pipeline and what is going cold?

What is owed, how old is it, what lands this month?

What is in flight, what is stuck, where is the queue?

What is the spend buying, and which channel deserves more?

What is selling, what is not shipping, what is running out?

Where is my order, my document, my invoice?

Who did what, what failed, what needs approving?

Revenue vs target

Target

Pipeline by stage

New62
Qualified44
Quoted28
Negotiation17
Won11

Receivables by age

Current
1–30 days
31–60
60+

Work in progress

Made to orderProductionOn time
Stock buildMaterialsShort
Made to orderQualityIn check
ReworkProductionPast SLA

Qualified leads by channel

Search
Referral
Social
Email
Direct

Fulfilment status

Dispatched62%
Packed18%
Picking13%
Held7%

Your account

Order · shipped
Invoice · paid
Change request · open
Contract · signed

System health

Active users48+3
Roles90
Failed jobs2+2
Pending approvals11+4

What belongs here

  • Cross-function KPIs
  • Trend vs target
  • Exceptions
  • Highlights
  • Stage funnel
  • Lead ageing
  • Conversion
  • Owner performance
  • Ageing buckets
  • Collection trend
  • Invoice queue
  • Margin
  • Work queue
  • Stage split
  • SLA breaches
  • Exceptions
  • Spend & leads
  • Channel comparison
  • Cost per lead
  • Trend
  • Orders & revenue
  • Product performance
  • Fulfilment status
  • Stock alerts
  • Scoped records
  • Status
  • Documents
  • Requests
  • Audit trail
  • Approvals
  • Job status
  • User & role management

Executive dashboard

Sales dashboard

Finance dashboard

Operations dashboard

Marketing dashboard

Ecommerce dashboard

Client-facing dashboard

Admin & internal dashboard

A dashboard is not only charts
Tables and queuesOften the most useful surface on the screen — the list of things someone has to work through.
Filters and drill-downThe number is the start of the question; the rows behind it are the answer.
Alerts and exceptionsWhat has gone outside its threshold, surfaced rather than looked for.
Actions and approvalsWhere a role is allowed to, acting on the record without leaving the view.

Connections

Your dashboard is only as useful as the data behind it.

Connections depend on the source's API, database, export or other available access. We confirm what is genuinely reachable for each system before it is scoped — some expose everything, some expose very little, and a few expose nothing at all.

CRM
API
live
  • Pipeline
  • Conversion
Sales dashboard
ERP
API or database
live
  • Fulfilment
  • Stock
Operations dashboard
Finance
API or export
scheduled
  • Collections
  • Ageing
Finance dashboard
Spreadsheet
Sync or upload
manual
  • Targets
  • Budgets
Wherever it belongs

The same architecture applies to

  • HRMS
  • Ecommerce platforms
  • Ad platforms
  • Payment systems
  • Databases
  • Internal tools
  • Public APIs
liveLive or near-live, where the source exposes an API or a database we can read.
scheduledA configured interval, where the source allows a periodic pull or export.
manualAn upload, where there is no API and no schedulable export.

The refresh model follows the source system, not a marketing promise.

Beyond looking

A dashboard can also tell you what needs doing.

A metric on its own is something to check. A metric with a condition against it is something that finds you. These are illustrative rules, not a configuration we ship — what gets watched is decided with you.

MetricOutstanding invoices
ConditionOver the agreed ageing threshold
ExceptionFinance alert
ActionLands in the follow-up queue with the invoice attached
MetricStock level
ConditionBelow the reorder point
ExceptionInventory exception
ActionRaises a procurement request for approval
MetricLead ageing
ConditionNo activity for the configured period
ExceptionSales exception
ActionReassigns or reminds the owner
MetricTime in stage
ConditionPast the SLA for that stage
ExceptionOperations exception
ActionEscalates to the shift lead

Three different things get called a dashboard.

A reportTells you what happened. Produced, read, filed.
A dashboardShows the current state, and lets you look into it.
An operational dashboardAlso carries the conditions and the actions, so the work starts from the screen.

Plenty of dashboards should stay read-only — a board view or a client view usually should. Whether yours acts on anything is a decision, not a default.

Access

What each person sees is part of the build, not a setting bolted on.

Access is decided per role, and often per field. An illustrative matrix — every business draws these lines differently, and yours is agreed before anything is built.

Full access
  • Revenue totals
  • Pipeline & deals
  • Orders & fulfilment
  • Invoices & collections
  • Stock & procurement
  • Audit trail
Founder
Full access
  • Pipeline & deals
Sales
Full access
  • Orders & fulfilment
  • Stock & procurement
Operations
Full access
  • Revenue totals
  • Invoices & collections
  • Payroll & salaries
Finance
Full access

Nothing in this zone for client.

Client
Limited or aggregated
  • Payroll & salaries
Founder
Limited or aggregated
  • Revenue totals
  • Orders & fulfilment
Sales
Limited or aggregated
  • Audit trail
Operations
Limited or aggregated
  • Pipeline & deals
  • Orders & fulfilment
  • Stock & procurement
  • Audit trail
Finance
Limited or aggregated

Nothing in this zone for client.

Client
Their own records only

Nothing in this zone for founder.

Founder
Their own records only

Nothing in this zone for sales.

Sales
Their own records only

Nothing in this zone for operations.

Operations
Their own records only

Nothing in this zone for finance.

Finance
Their own records only
  • Orders & fulfilment
  • Invoices & collections
Client
Not visible

Nothing in this zone for founder.

Founder
Not visible
  • Invoices & collections
  • Payroll & salaries
  • Stock & procurement
  • Audit trail
Sales
Not visible
  • Revenue totals
  • Pipeline & deals
  • Invoices & collections
  • Payroll & salaries
Operations
Not visible

Nothing in this zone for finance.

Finance
Not visible
  • Revenue totals
  • Pipeline & deals
  • Payroll & salaries
  • Stock & procurement
  • Audit trail
Client
See the full matrix
DataFounderSalesOperationsFinanceClient
Revenue totalsfulllimitednonefullnone
Pipeline & dealsfullfullnonelimitednone
Orders & fulfilmentfulllimitedfulllimitedOwn
Invoices & collectionsfullnonenonefullOwn
Payroll & salarieslimitednonenonefullnone
Stock & procurementfullnonefulllimitednone
Audit trailfullnonelimitedlimitednone
Role-based accessA role decides which dashboards and which screens exist for that person at all.
Field-level restrictionA role can see a record without seeing every column on it — an order without its margin.
Team and department scopeThe same dashboard, filtered to one team, one branch or one region.
Client and partner viewsA logged-in outsider sees only their own records, on the same underlying data.
Admin visibilityWho changed what, and when — including changes to access itself.

These are access controls designed into the system. Security and compliance requirements are scoped per project — no certification or compliance standard is implied unless expressly included in the agreed scope.

What gets shaped

The dashboard is shaped around how your team makes decisions.

Two businesses can run the same systems and still need different screens, because they decide differently. These are the dimensions that actually change between builds.

Metrics & formulasWhat counts as a qualified lead, a closed order or revenue — your definitions, applied everywhere.
Filters & viewsThe cuts your team actually asks for, saved so nobody rebuilds them.
Roles & accessWho sees which dashboard, and which columns inside it.
Reports & exportsWhat leaves the system, in what shape, and to whom.
Alerts & conditionsWhat is worth interrupting someone for, and what is not.
Actions & approvalsWhat a role can do from the screen without leaving it.
Data sourcesWhich systems feed it, and what happens when one of them changes.
Interface & brandingYour terminology, your layout, your marks — for internal and client-facing views alike.
Where it runs
Desktop webThe primary surface for anything with a table or a wide comparison.
TabletThe same dashboard, laid out for a narrower screen and for touch.
Compact mobile webA reduced view built around the few numbers and actions that matter on a phone.
Role-specific screensA single-purpose view for one job — a floor screen, an approvals screen.
Client or customer viewA logged-in space showing only that customer's own records.
A responsive dashboard can be part of the web system. A native mobile app is a separate product scope.App development
Reporting and exports
  • Saved views
  • Filtered reports
  • CSV and spreadsheet export
  • PDF reports where required
  • Scheduled generation
  • Email distribution
Configurable capabilities, not defaults. Which of these a build includes is scoped — not every format is switched on for every dashboard.

Delivered

A dashboard we actually built.

One direct case, not three. ProMedia's own record names this system; most Branditify projects list "analytics and tracking" as a deliverable, and that is analytics setup, not a dashboard, so it is not evidence for this page.

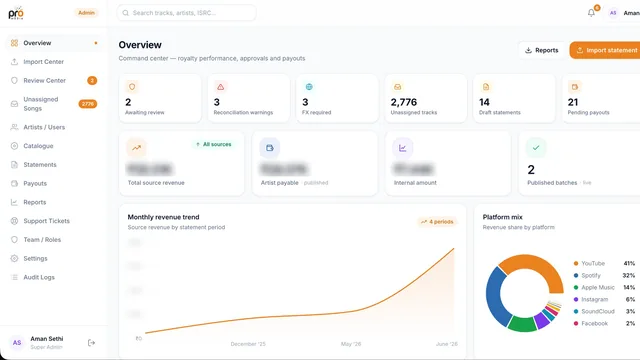
ProMedia — royalty operations platform

Royalty operations platform

ProMedia

A royalty operations platform whose operator side is a reporting surface: statements, artist-side views and the admin console behind them. Its own record names this system, which is what makes it evidence of the thing this page sells rather than work that resembles it.

  • Platform design and build
  • Admin side
  • Artist side
  • Public entertainment website

The scope lines above are taken verbatim from that project's recorded deliverables.

View case study

Related reporting work
Reporting & performance visibility

OffLimitsCampaign performance tracking and growth reporting across a performance engagement.This is reporting work, not a dashboard product. It is here because the reporting evidence is real and published — not to suggest Branditify built OffLimits a dashboard system.
View case study

Cost

What changes the cost of a dashboard?

Two businesses asking for "a dashboard" can be a long way apart. These are the things that decide it, roughly in the order they usually matter.

Number of data sourcesOne system is a different build from six that have to agree with each other.
Connection complexityA clean API is straightforward. A tool with no export is not.
Data quality and cleanupDuplicates, inconsistent stages and missing history all have to be resolved before a number can be trusted.
Number of dashboards and viewsOne executive view, or a view for every department.
Metric and formula complexityA count is easy. An attribution model is not.
Users and rolesHow many kinds of people use it, and how differently they are allowed to.
Reports and exportsScheduled generation and distribution are their own scope.
Alerts and actionsWatching a threshold is small. Acting on it inside the system is not.
History and migrationHow much of the past has to come across, and what state it is in.
SurfacesDesktop only, or desktop plus a client view plus a compact mobile view.
Access and security requirementsField-level restriction and audit trails add real work.

Questions

Dashboards, answered.

What is a business dashboard?

A single screen that shows the current state of your business, built on the systems that already hold the data. A good one carries more than charts: the tables and queues someone has to work through, the filters that let a number be opened up, and often the exceptions that need attention. It is not a report you produce and file — it is the view you work from.

Can a dashboard combine data from multiple systems?

Yes, and that is usually the point. A CRM, an ERP, an accounting system and a spreadsheet can all feed one view. What makes it work is the metric layer in between: each number gets one definition, so revenue means the same thing on every screen regardless of which system it came from.

Is dashboard data always real-time?

No, and anyone promising that is describing your source systems rather than their own software. Where a source exposes an API or a database, numbers can move within seconds to minutes. Where it only allows a periodic export, the dashboard refreshes on a schedule and says when it last ran. Where there is no API and no schedulable export, someone imports a file. The refresh model follows the source system, not a marketing promise.

Can different users see different dashboards?

Yes. Access is decided per role and often per field — a role can see an order without seeing its margin, or see only its own team, branch or region. Customers and partners can be given a logged-in view of their own records on the same underlying data. What each person sees is designed into the build rather than switched on afterwards.

Can dashboards include alerts and actions?

They can. A metric with a condition against it becomes an exception that finds you: invoices past their ageing threshold, stock below reorder, a deal with no activity, a job past its SLA. Where a role is permitted to, the resulting action can happen from the screen. Plenty of dashboards should stay read-only, though — a board view or a client view usually should.

Can it use the software and spreadsheets we already run?

That is the normal case — a dashboard is built on your systems rather than replacing them. A database can usually be read directly; a spreadsheet can be synced or uploaded, which is often the right answer for targets, budgets and anything that has not moved into a system yet. What is genuinely possible depends on the specific tool: connections depend on the source's API, database, export or other available access, and we confirm what is reachable for each system before it is scoped rather than promising integrations in general.

Can dashboards work on mobile?

A responsive dashboard can be part of the web system, with a compact mobile view built around the few numbers and actions that matter on a phone rather than a shrunken desktop screen. A native mobile app is a separate product scope, not something a dashboard build includes by default.

What is the difference between a dashboard and a report?

A report tells you what happened — it is produced, read and filed. A dashboard shows the current state and lets you look into it. An operational dashboard goes further and carries the conditions and actions, so the work starts from the screen. All three are useful; they are not the same thing, and which one you need changes what gets built.

What affects the cost of a custom dashboard?

Mostly the data rather than the screens: how many sources, how reachable each one is, and what state the data is in. After that, how many views and roles, how complex the metric definitions are, whether reports and alerts are in scope, how much history has to migrate, and how many surfaces it runs on. The pricing page explains how we scope it; a number needs a conversation.